Making operational performance easier to act on
Product craft
- Link:
- www.leadsimple.com
- Client:
- LeadSimple
- Role:
- Product Designer
- Year:
- 2024
LeadSimple helps property managers organize their operations. I worked with another designer and two engineers on a performance dashboard, helping customers understand what their teams were doing and see the value of the product sooner.
The problem
Churn was rising, retention was falling, and the company was struggling to meet revenue targets. We needed a solution we could deliver before the end of the quarter, with limited development time.
Customers were paying from day one, but it took an average of seven weeks for them to see the value of LeadSimple. Our goal was to make that value visible sooner, giving them a clearer view of their team's performance.
Research and decisions
I revisited past customer interviews and followed up with customers who had raised the same concern: they couldn't track what their teams were doing or how well they were doing it. I organized the feedback in Notion to identify recurring issues and summarized the findings into key insights.
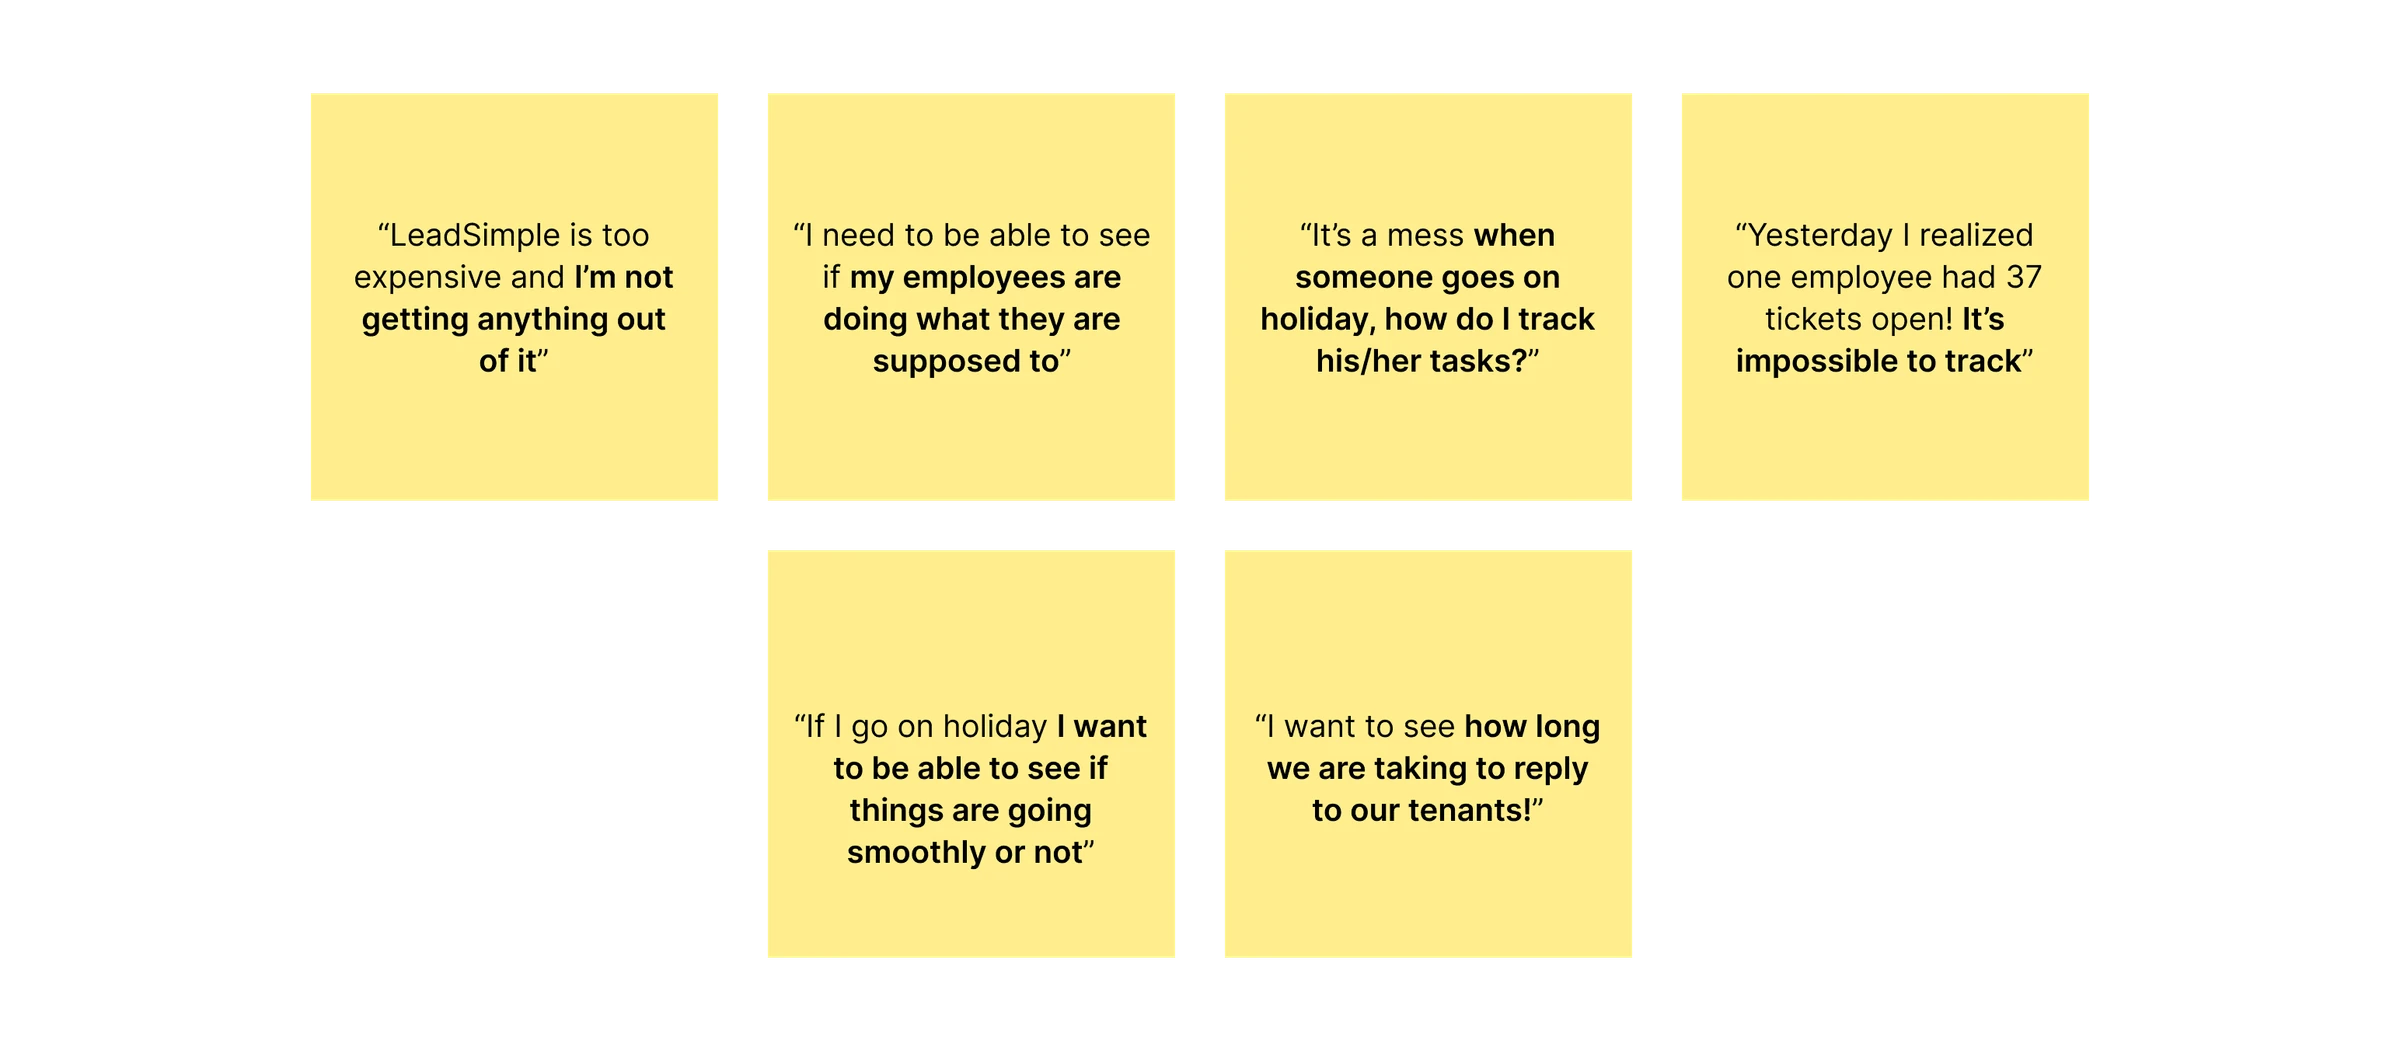
Recurring themes from customer interviews.
The interviews made it clear that access to more numbers wasn't enough. Working with the other designer, we decided the dashboard needed to tell a story, moving from a general view of the business into the details that explained its performance.
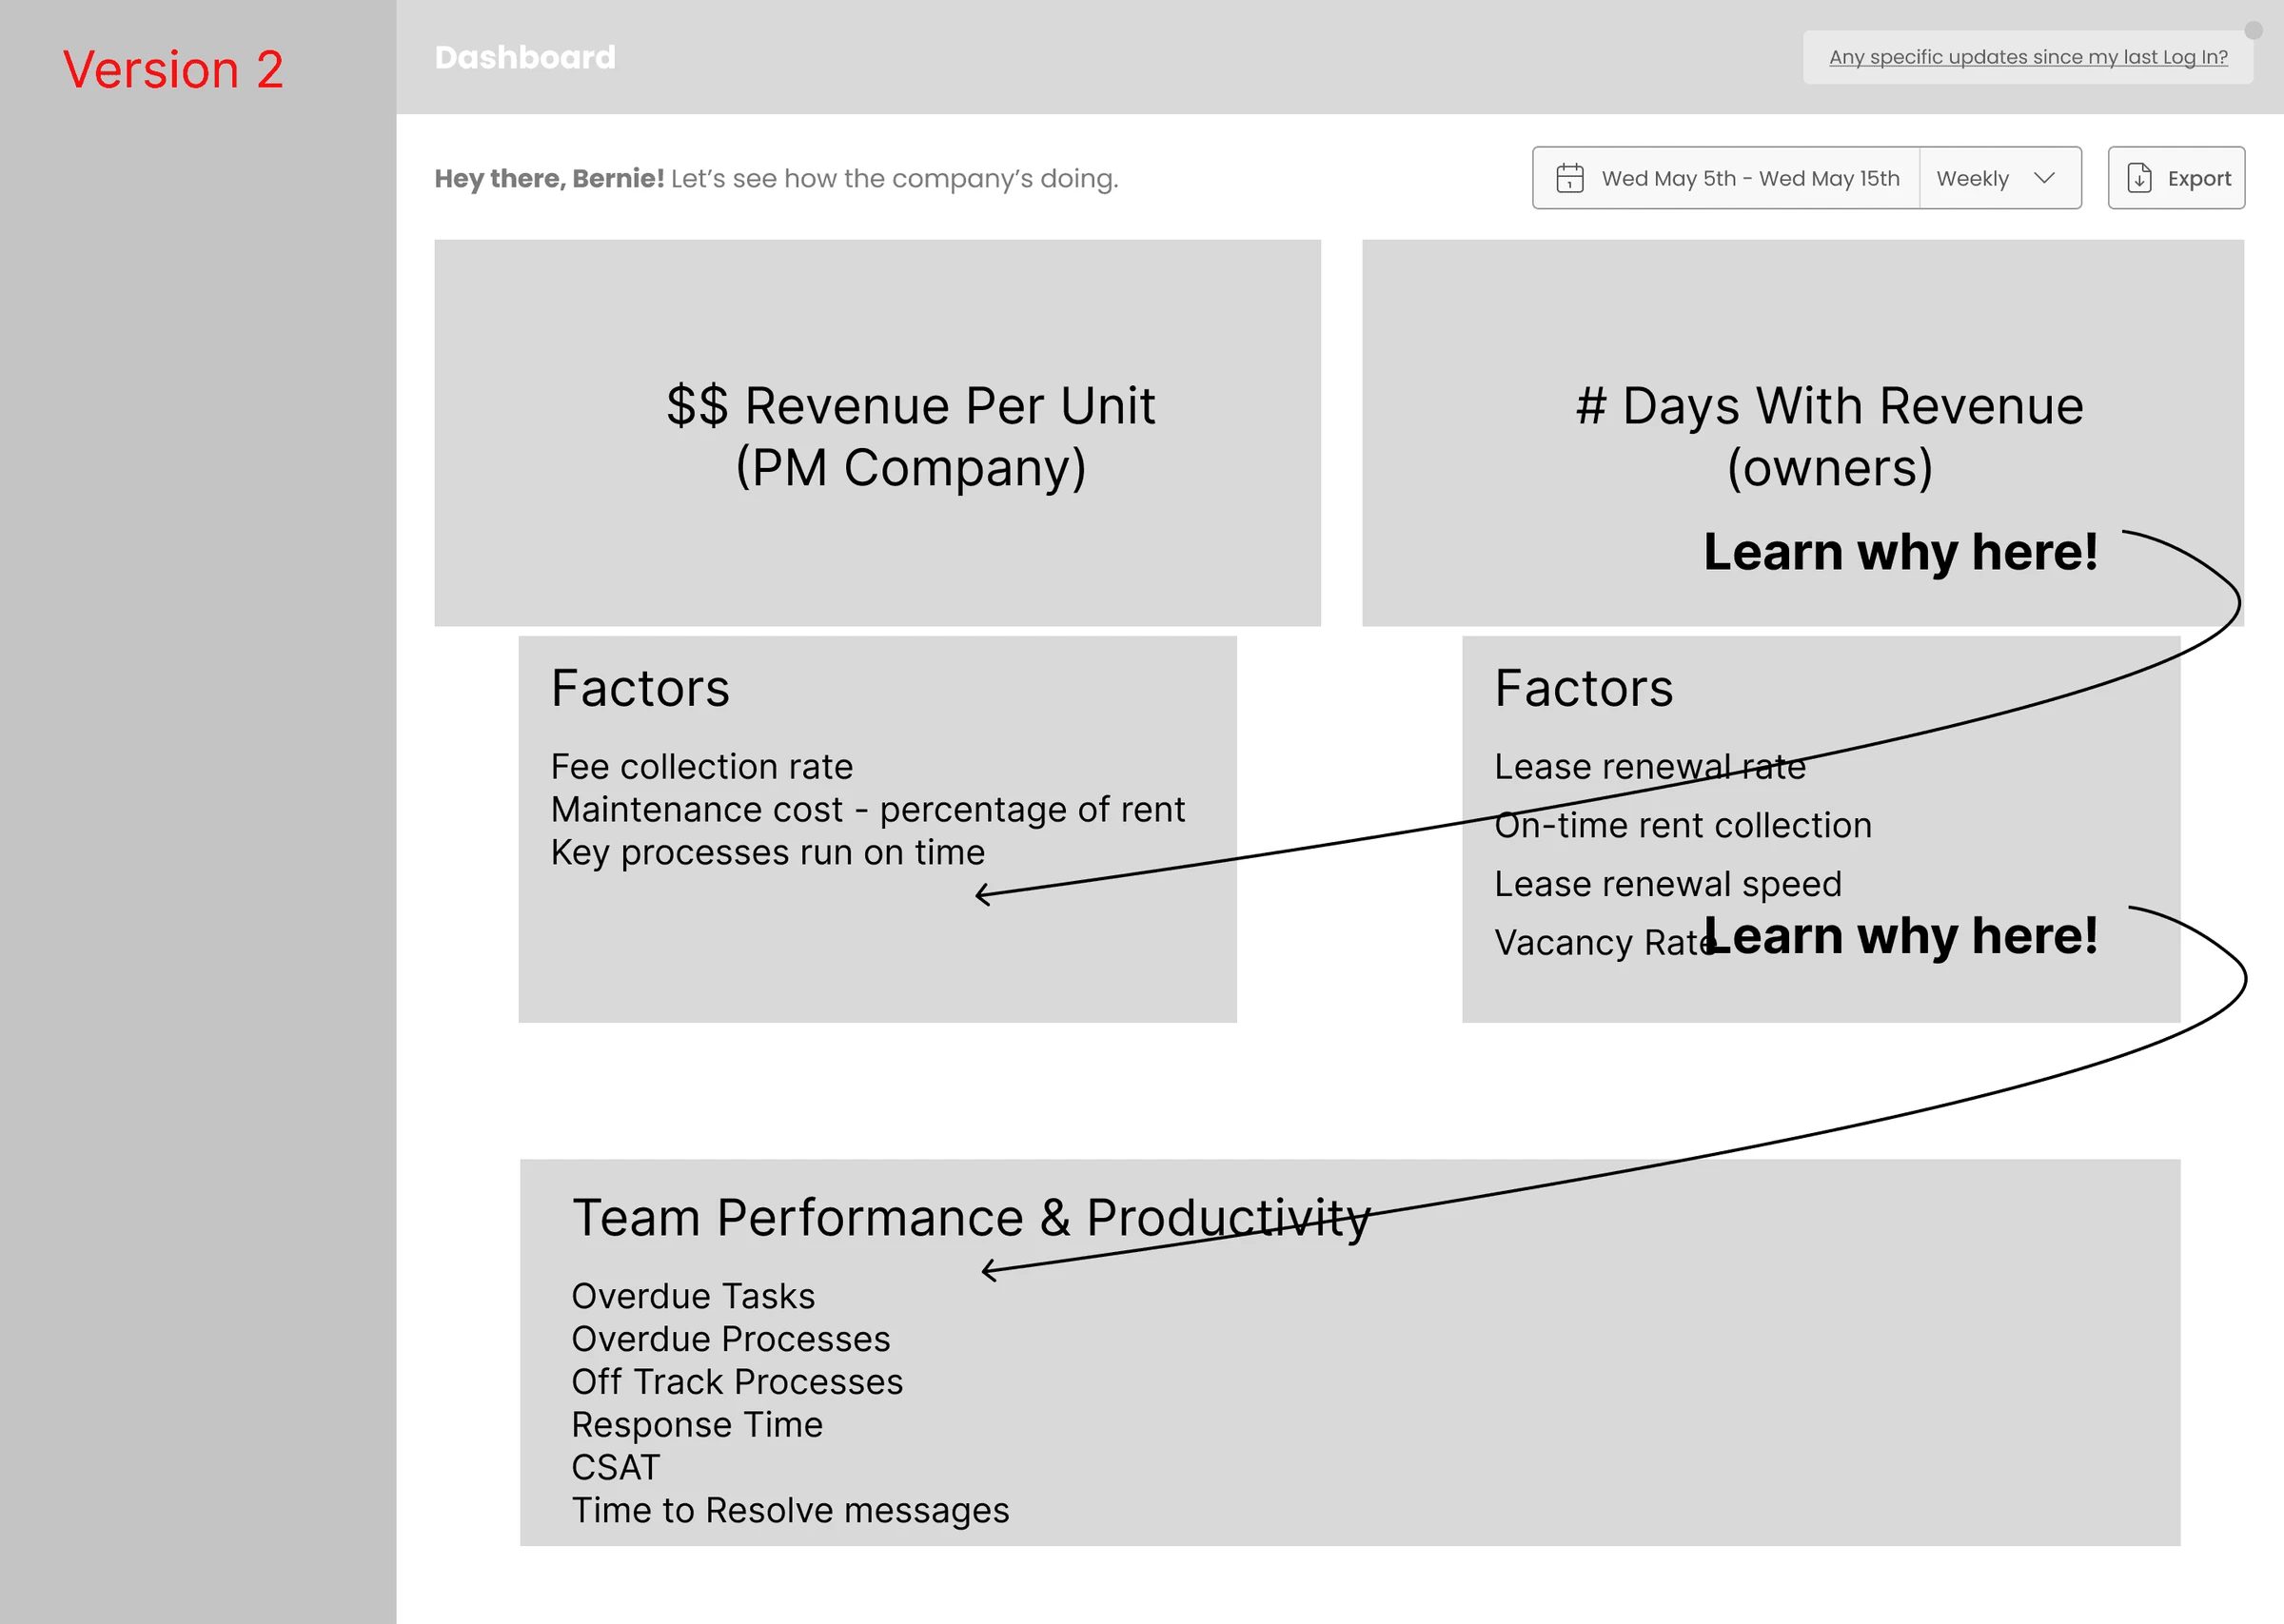
The dashboard's information flow, from overview to detail.
The solution
We explored and iterated on wireframes to understand which information customers needed to see first. Competitive research helped us question what belonged on the dashboard and how each metric would support a useful decision.
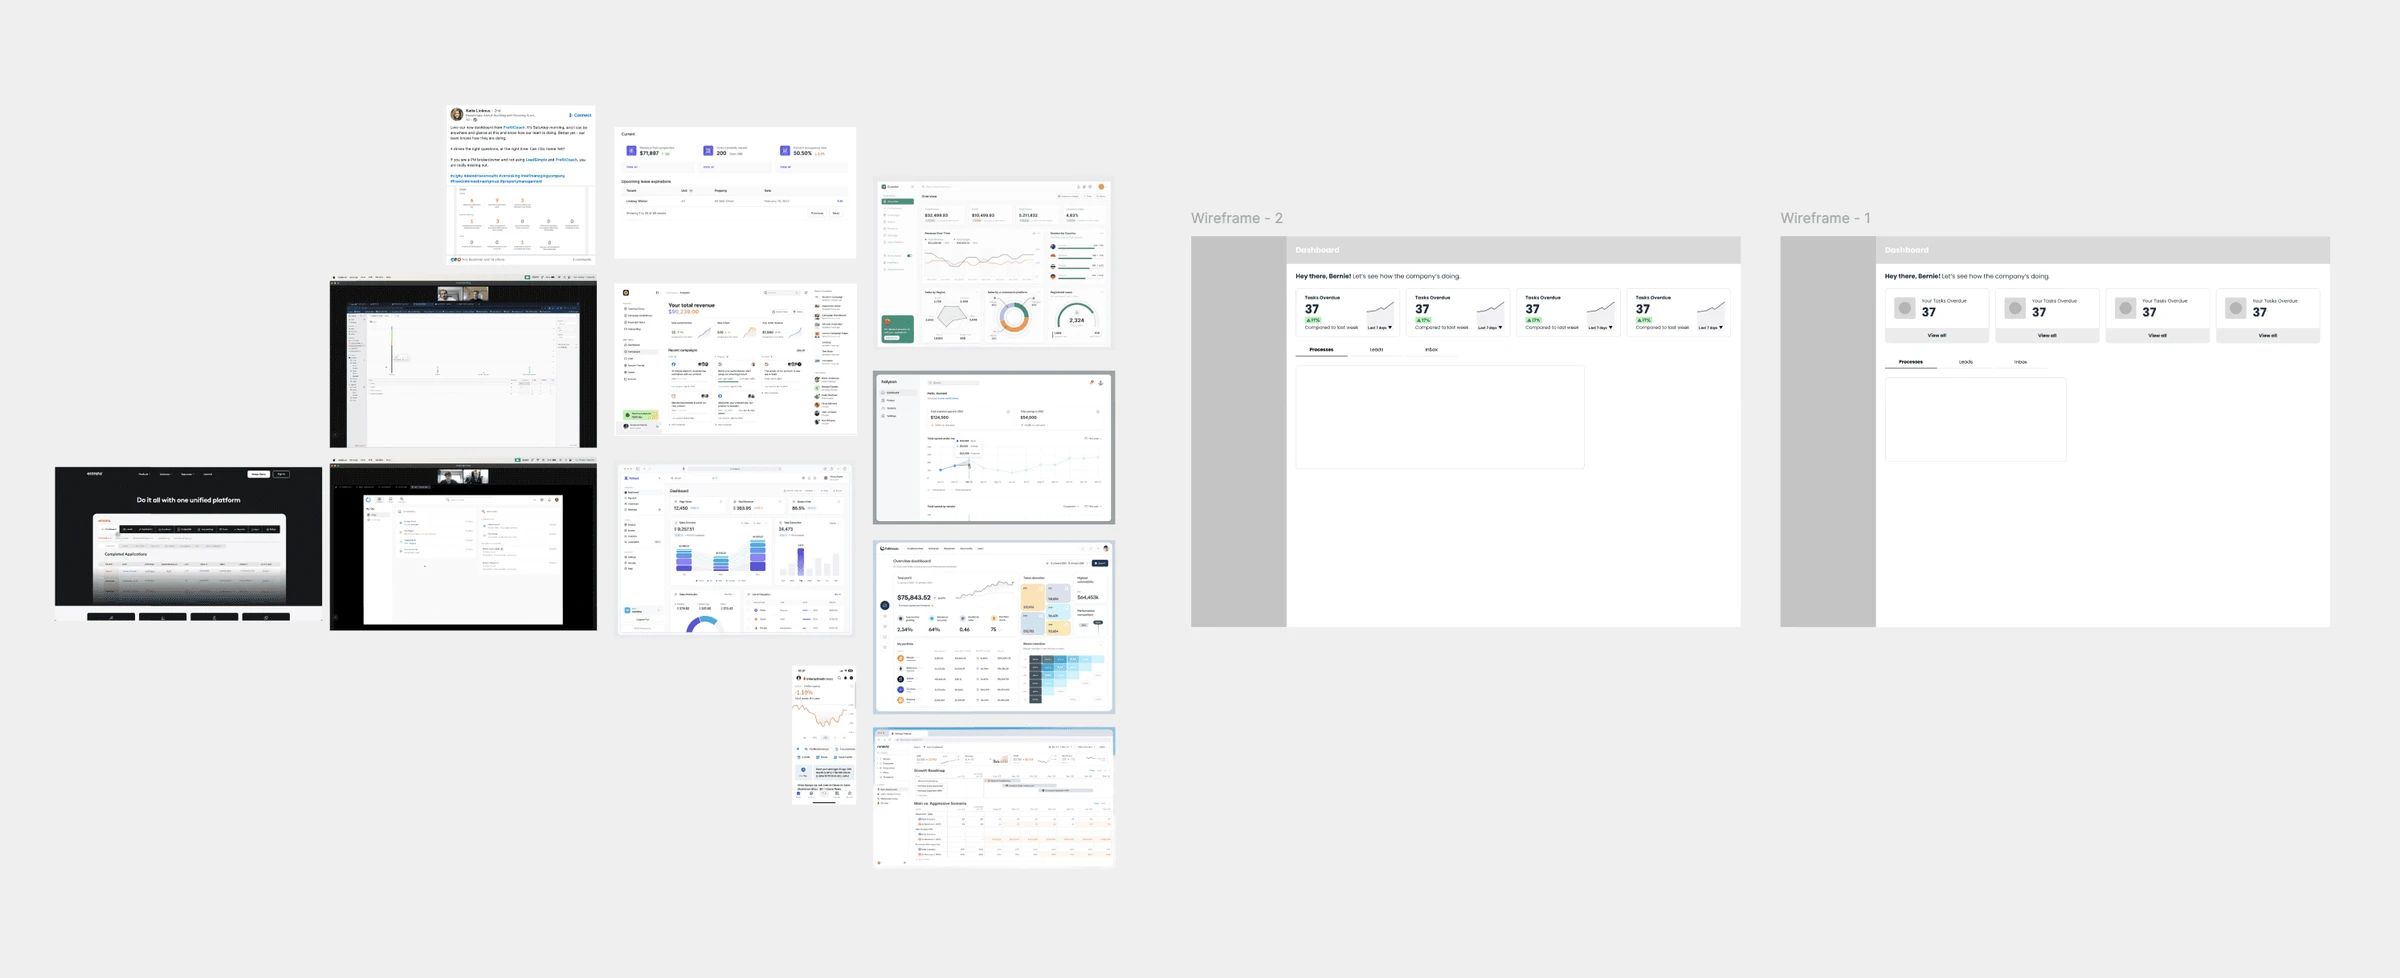
Early explorations of the dashboard structure.
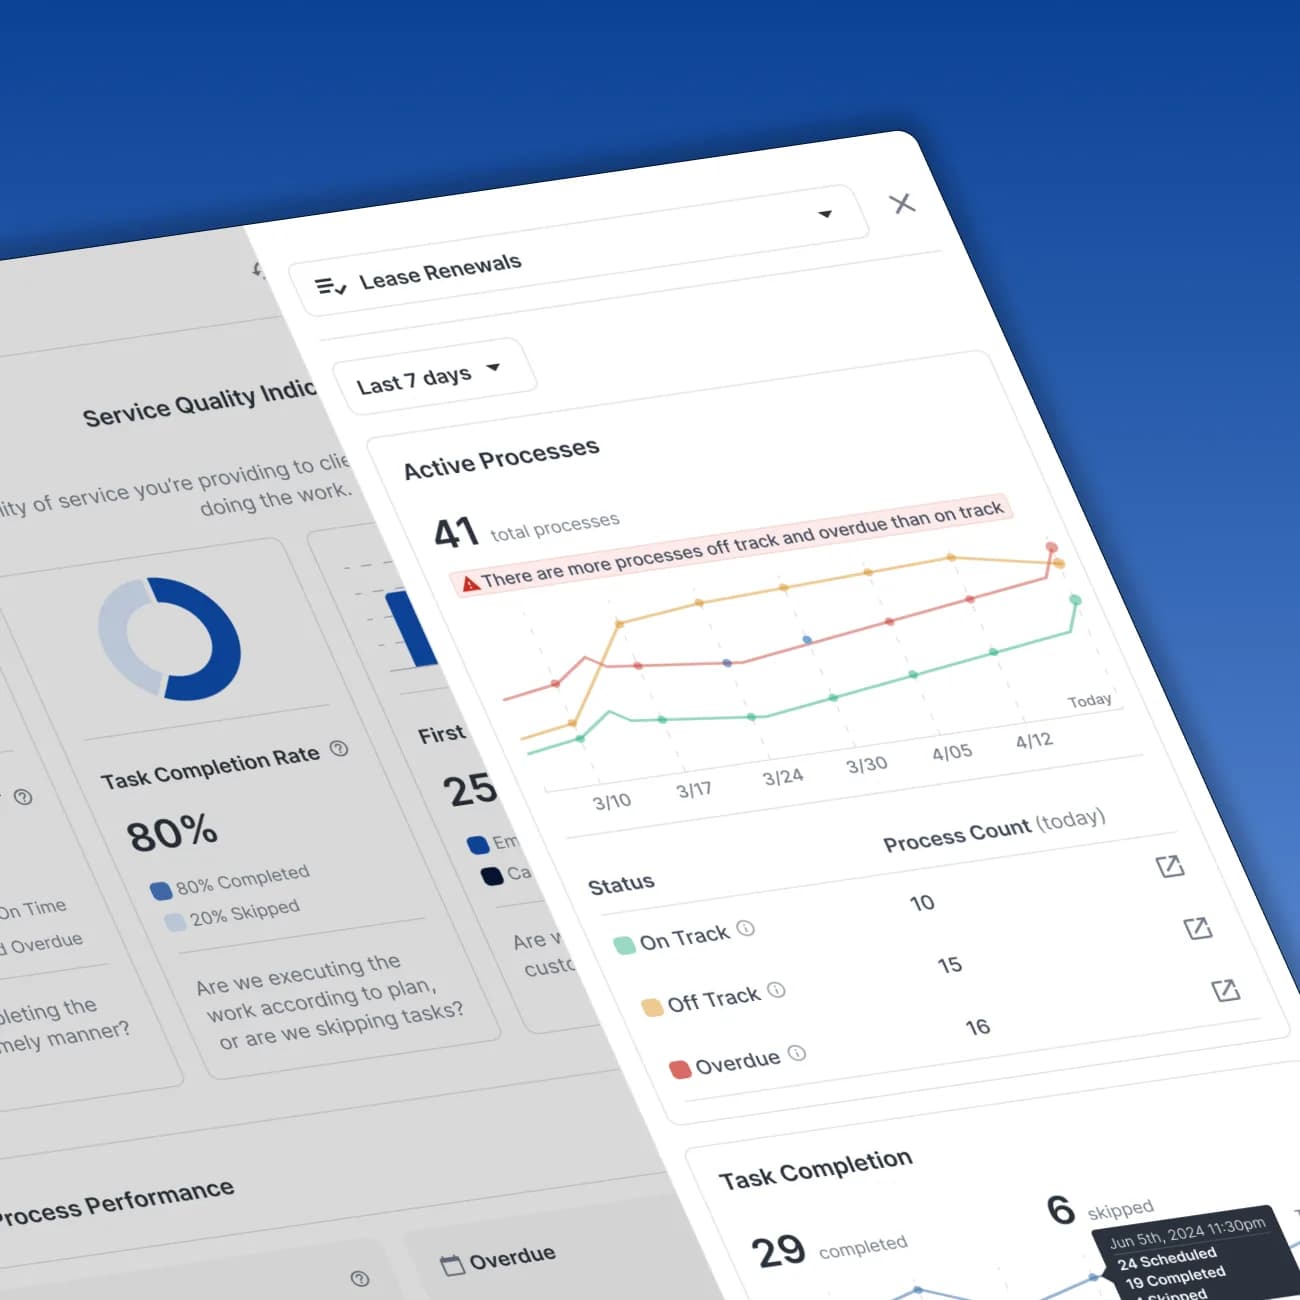
The final dashboard brings process and team performance into one view. Customers can start with the overall picture, then look more closely at completion rates, response times, and individual team members.
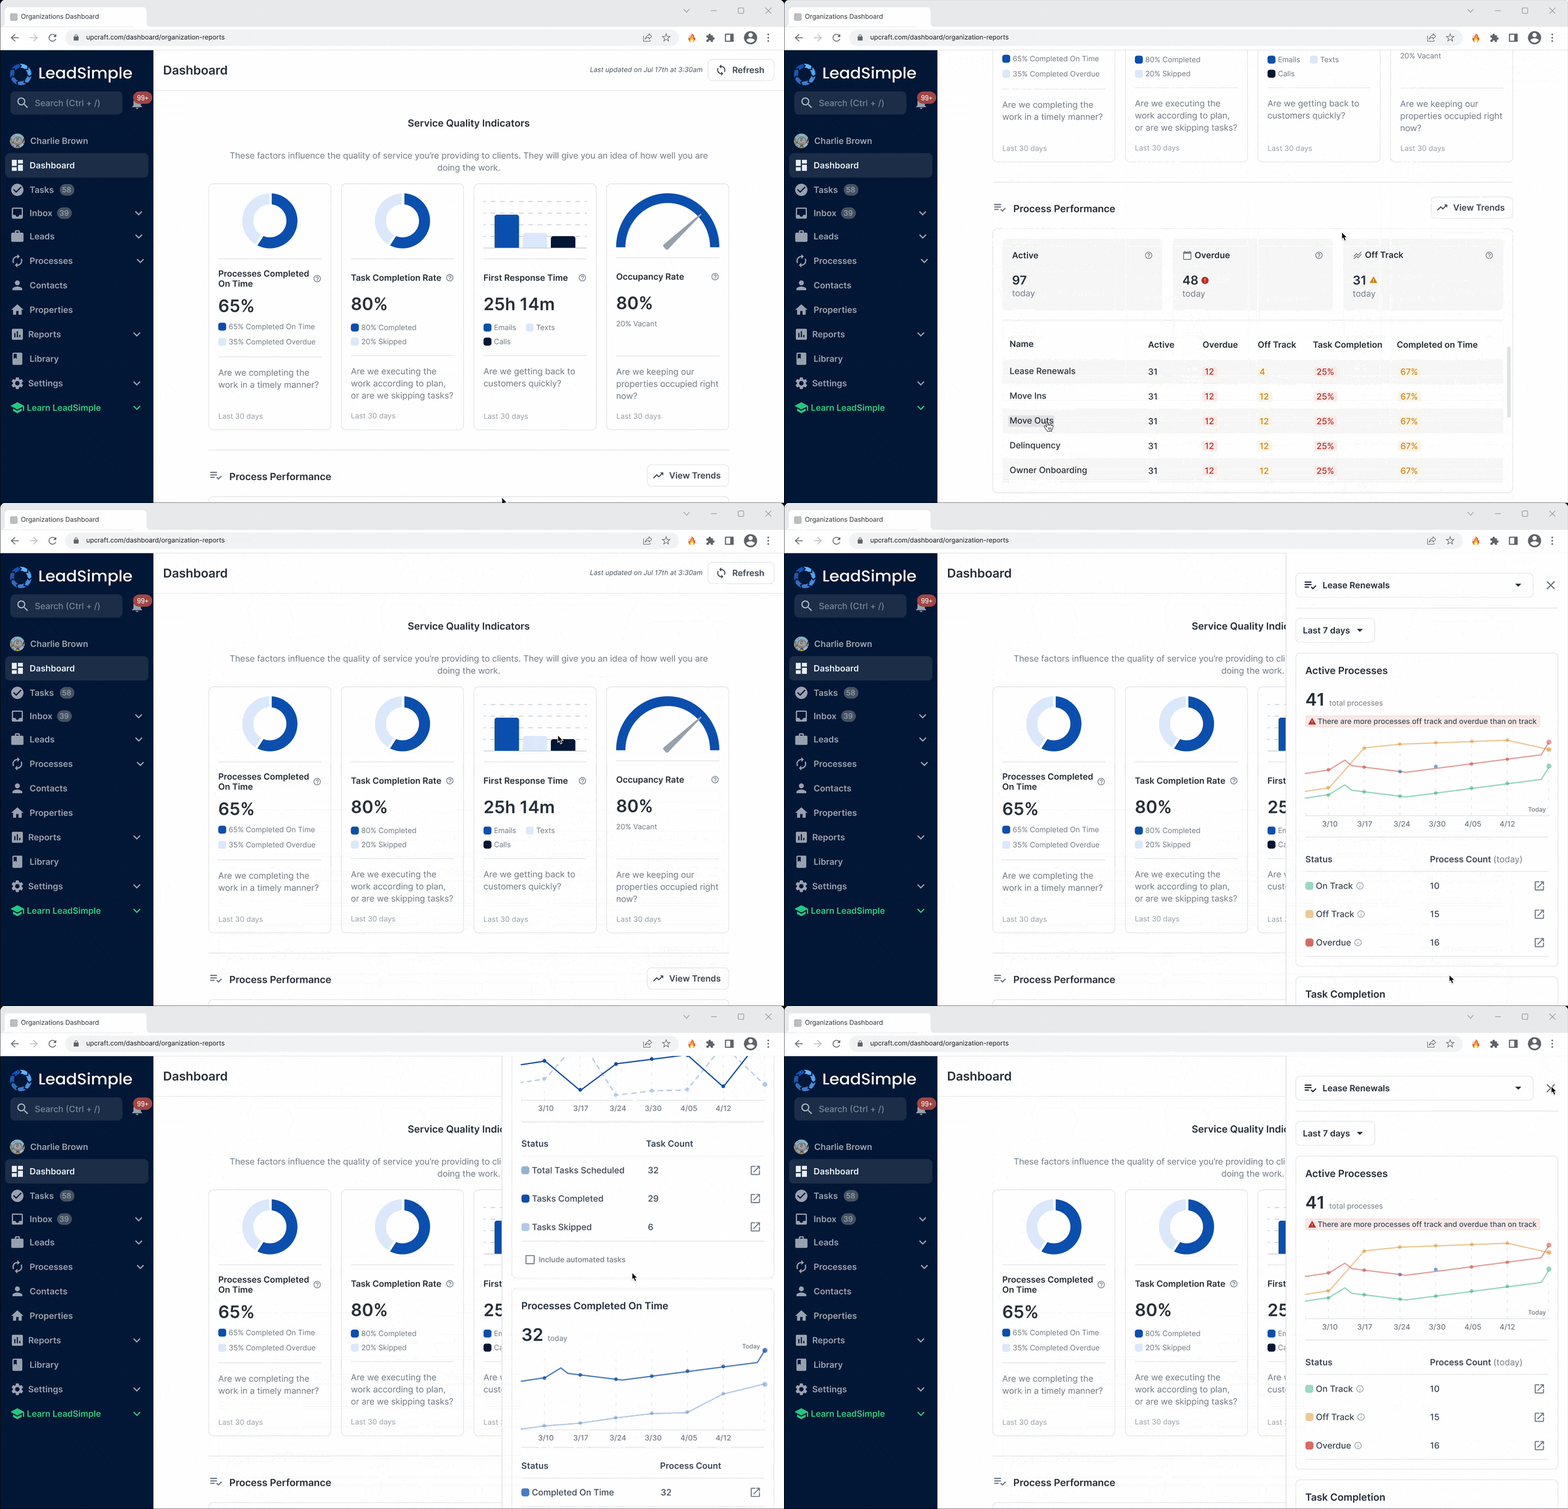
The finished dashboard, connecting an overview with detailed performance data.
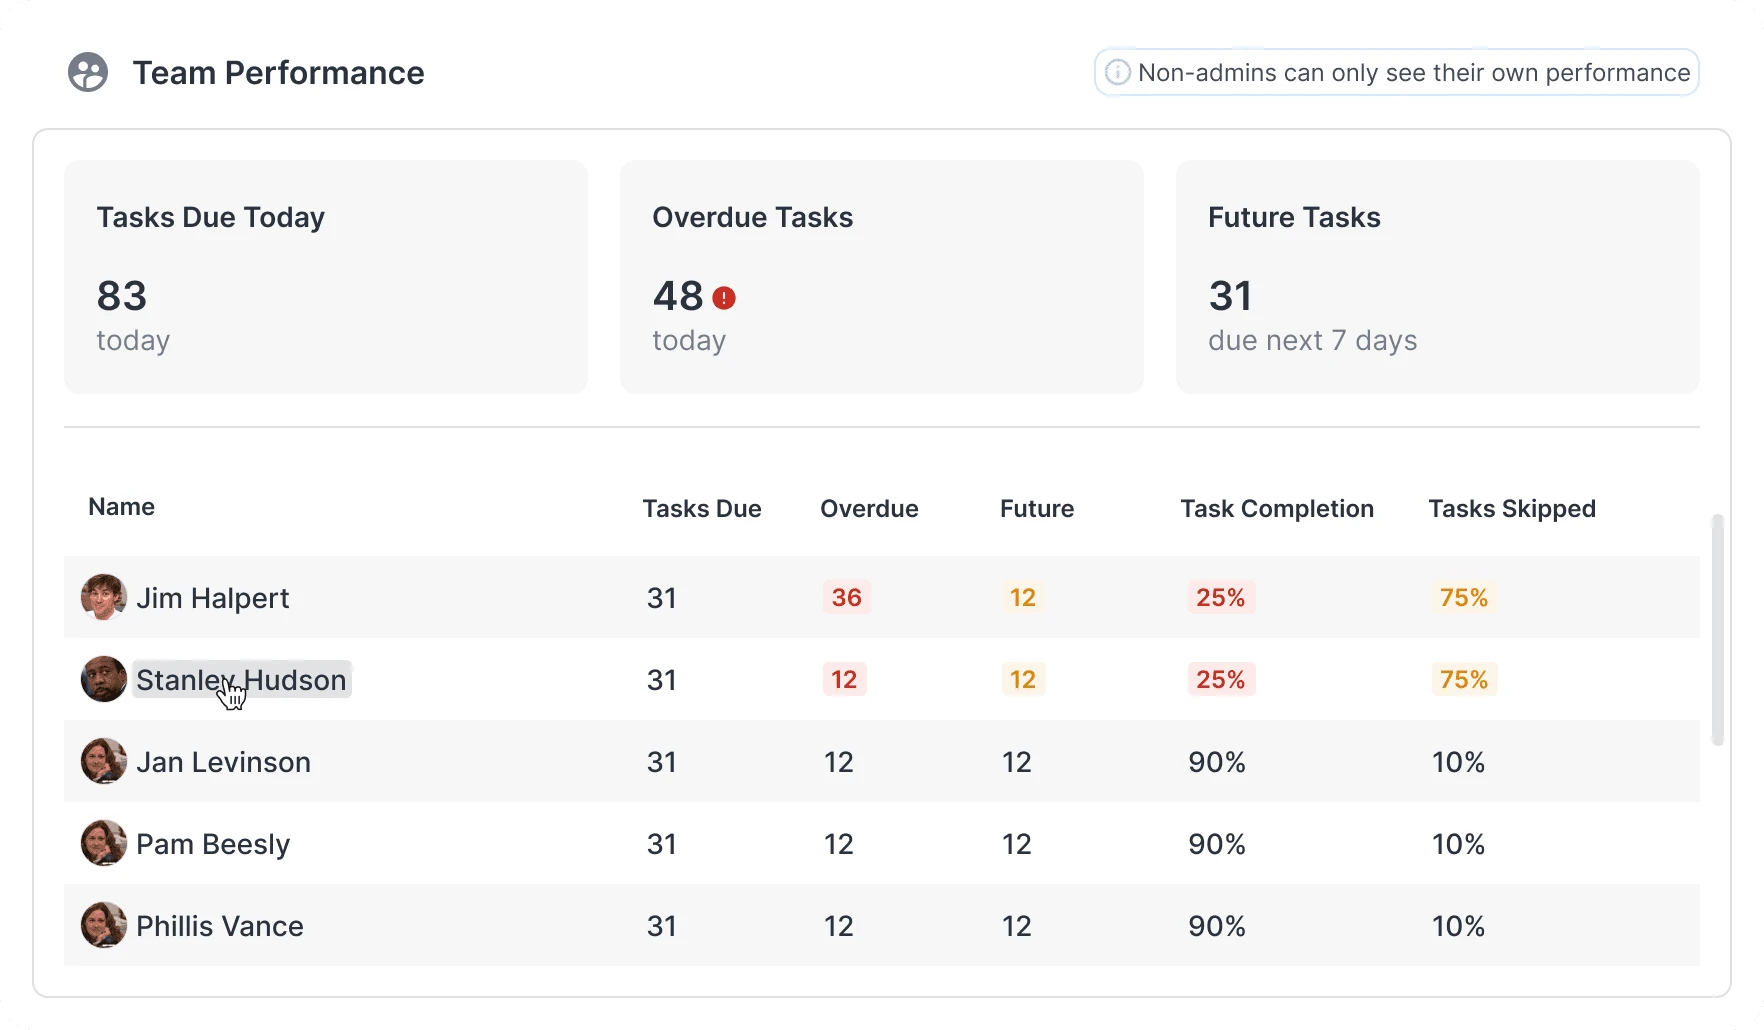
A closer look at team performance.
Outcomes and learnings
Engagement Score rose from 19 to 35.2. The dashboard was a shared effort across design, engineering, customer success, and sales, with each team contributing to the goal of improving customer engagement.
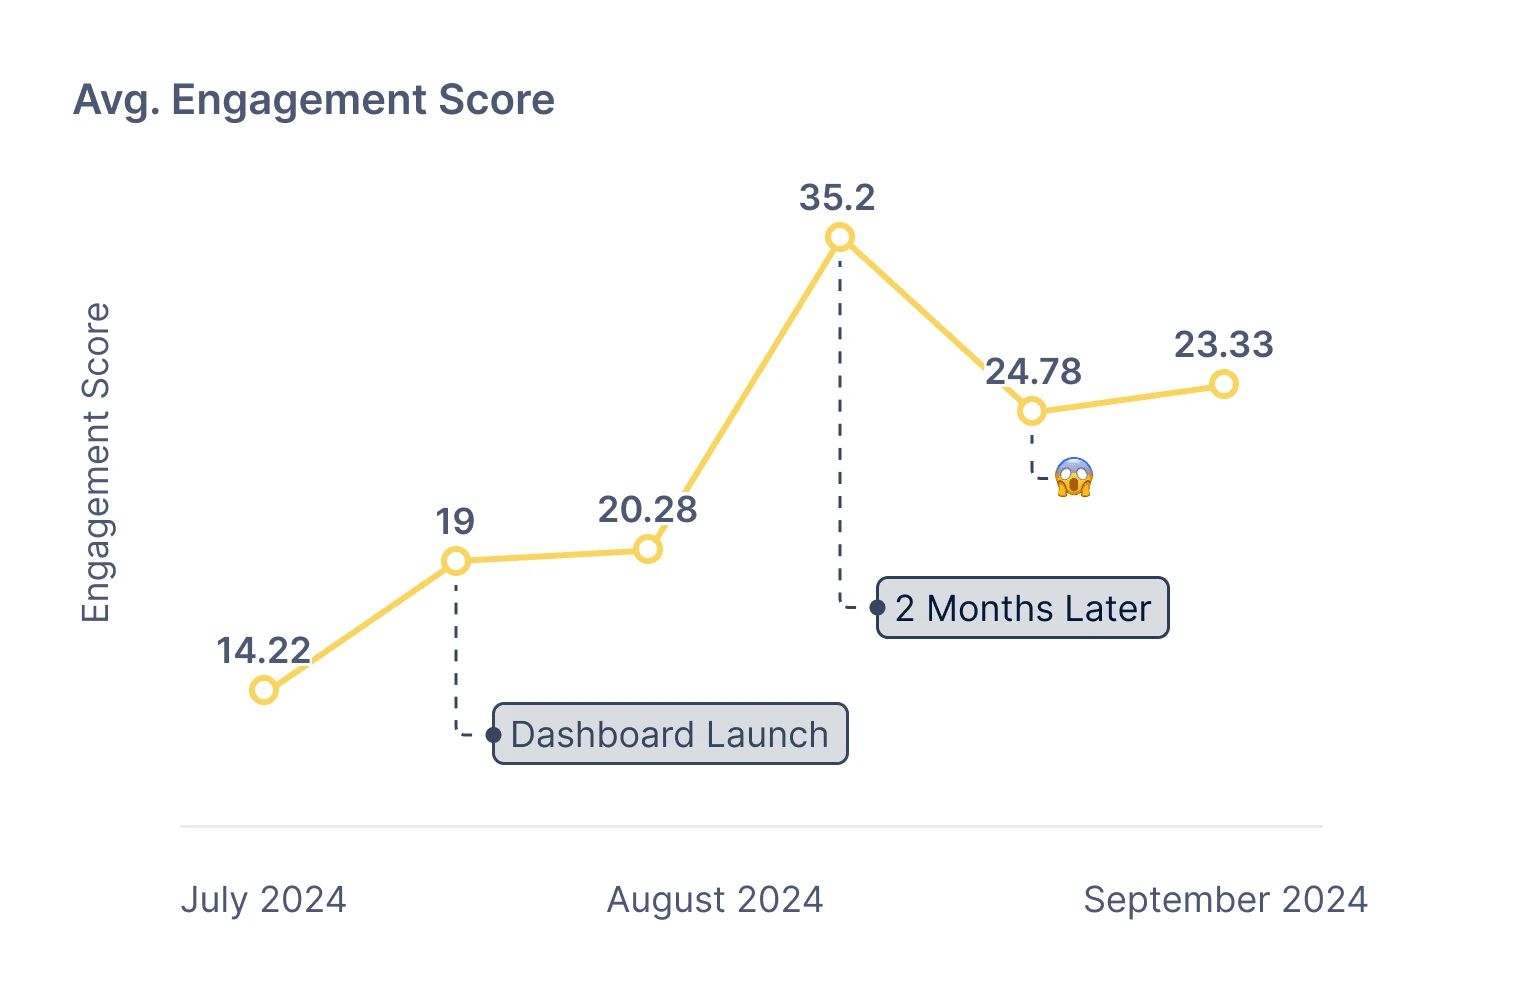
Engagement Score around the dashboard launch.
The biggest design lesson was the importance of storytelling: a dashboard needs a beginning and an ending, not just a collection of metrics. The next step was to keep monitoring performance and understand whether the engagement improvement translated into lasting retention and revenue impact.